Fusedash
Fusedash turns your team's data into clear dashboards so everyone can act on insights together.
Visit
About Fusedash
Fusedash is the collaborative AI data visualization platform designed to unify your team around a single source of truth. It transforms the often fragmented process of data analysis and reporting into a streamlined, cooperative workflow. By bringing dashboards, interactive charts, detailed maps, and narrative reports into one connected workspace, Fusedash eliminates the need to rebuild the same logic across multiple, disconnected tools. This platform is built for teams across leadership, marketing, operations, and beyond who are tired of manual reporting cycles, conflicting data stories, and time wasted reconciling numbers. Its core value proposition is consistency and efficiency: you define your key metrics and KPIs once, and then reuse those consistent definitions across every view and report. This ensures everyone in the organization is aligned, looking at the same trusted numbers, and empowered to act. With integrated AI features like natural language data chat and smart visualization assistance, Fusedash makes data exploration accessible to all team members, fostering a culture of shared insight and collaborative decision-making. It’s more than a dashboard tool; it’s a unified workspace where raw data becomes a catalyst for team alignment and decisive action.
Features of Fusedash
Flexible, Unified Workspace
Fusedash provides a single, cohesive workspace where teams can build the right view for every audience without duplicating effort. You can transform the same core dataset into interactive dashboards for real-time monitoring, detailed charts for analysis, narrative reports for stakeholders, or geographic maps for regional insights. This flexibility allows different departments to access the information that matters most to them, all from a consistent data foundation, reducing back-and-forth and ensuring seamless collaboration across the organization.
AI-Powered Chart Generator
Jumpstart your data storytelling with the AI Chart Generator. This feature allows you to create clear, impactful visuals from your CSVs or connected APIs in minutes. The AI assists in selecting the optimal chart type, applying meaningful comparisons, and refining labels to ensure the visual accurately tells your data's story. These charts can be used as powerful standalone assets or seamlessly integrated into larger dashboards and reports, accelerating the path from raw data to shared understanding.
Integrated AI Data Chat
Foster a collaborative exploration environment with the integrated AI Data Chat. Team members can ask questions about their data in plain, natural language, breaking down barriers to analysis. The smart chat can suggest relevant metrics, propose breakdowns, and recommend the best chart types for your inquiry. You can then instantly turn these conversational insights into permanent, shareable dashboard views, making data discovery an intuitive and cooperative process for everyone.
Consistent Metric Definitions & Reusability
At the heart of Fusedash is the principle of consistency. You define your key performance indicators, dimensions, and calculation logic once in a centralized library. These trusted definitions are then automatically reused across every dashboard, chart, and report created on the platform. This eradicates conflicting numbers and manual reconciliation, ensuring that leadership, marketing, and operations are all working from the same trusted dataset, which builds alignment and accelerates collective action.
Use Cases of Fusedash
Cross-Departmental KPI Alignment
Unify your organization around shared goals by creating a central command center. Leadership can monitor high-level business health on executive dashboards, while marketing drills into campaign performance and operations tracks real-time logistics—all using the same underlying metrics. This eliminates siloed reporting and ensures every team discussion is grounded in a single, consistent version of the truth, driving strategic alignment.
Streamlined Stakeholder Reporting
Transform the tedious monthly reporting cycle into an efficient, collaborative process. Build narrative-driven "storytelling" reports that combine live charts, key metrics, and explanatory text. Share these dynamic reports with stakeholders, who can interact with filters and see the most current data without waiting for a new document. This empowers teams to provide context and clarity, reducing follow-up questions and fostering better-informed decisions.
Collaborative Market & Geographic Analysis
Enable sales and marketing teams to visually analyze performance by region using interactive maps. By combining internal sales data with public demographic or market data within Fusedash, teams can collaboratively identify trends, pinpoint opportunities, and allocate resources effectively. This shared geographic insight helps regional managers and headquarters align on strategy and execute locally relevant actions.
Rapid, Ad-Hoc Data Exploration
Empower every team member to be a data explorer. When a question arises in a meeting, use the AI Data Chat to ask "What drove the sales spike last week?" or "Show me user sign-ups by device type." Instantly generate charts and breakdowns to answer these questions on the fly. This democratizes data access, turns curiosity into immediate insight, and fosters a proactive, data-informed culture across all teams.
Frequently Asked Questions
What types of data sources can I connect to Fusedash?
Fusedash is built for flexibility in data integration. You can start by uploading CSV files directly for quick analysis. For live, updated data, you can connect to various business applications and databases via their APIs. The platform also allows you to enrich your internal data with relevant public datasets, especially useful for adding geographic or market context to your visualizations and reports.
How does Fusedash ensure data consistency across teams?
Fusedash uses a centralized metric definition system. Your team defines each key metric, KPI, and dimension (like "Monthly Recurring Revenue" or "Active User") once in a shared library. Whenever anyone builds a dashboard, chart, or report, they select from these pre-defined, trusted metrics. This guarantees that the calculation logic is identical everywhere, eliminating discrepancies and ensuring everyone analyzes and debates using the same numbers.
Can I use Fusedash just to create single charts, or do I need to build full dashboards?
Absolutely, you can use Fusedash for both. The AI Chart Generator is perfect for creating standalone, publication-ready charts quickly from your data. If you need a comprehensive view, you can then assemble those charts and more into a full dashboard. The platform is designed to support your workflow, whether you need a single visual for a presentation or a live monitoring interface for your entire team.
What makes Fusedash's AI features different?
Fusedash's AI is integrated directly into the collaborative workflow. The AI Data Chat lets you interact with your data conversationally, making exploration accessible to non-technical team members. The chart AI suggests the best ways to visualize your specific data. Crucially, these AI insights aren't dead-ends; you can instantly convert chat answers and generated charts into persistent, shareable views within your team's workspace, turning fleeting discoveries into institutional knowledge.
Explore more in this category:
Similar to Fusedash
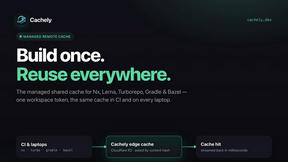
Cachely
Managed remote build cache for Nx, Lerna, Turborepo, Gradle, and Bazel. Reuse artifacts across CI and developer machines without running cache infrast
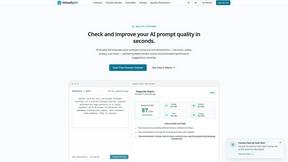
AIQualityHQ
Free AI Prompt Quality Checker to evaluate and improve your AI prompt quality across six core dimensions instantly.
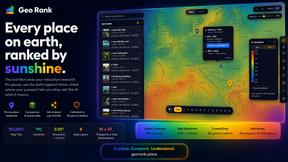
GeoRank
Planning a relocation or long-term stay abroad? Compare places on sunshine, cost, tax, visa access for your passport, then ask AI about your short

Video2URL
Turn videos into clean, shareable, trackable URLs in seconds.
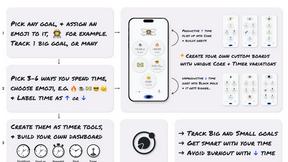
Flowton
Pick a goal, label time spent as Up time or Down time. Improve the ratio.
Social Fetch
Social media research API: scrape profiles, posts, hashtags, comments, and metrics. Social data API with JSON, cursor pagination, 20+ networks.
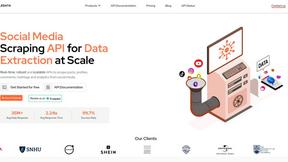
EnsembleData
EnsembleData provides real-time social media APIs that help your team scrape and analyze posts, profiles, and trends at scale.