Dividend Data
Access instant stock data and 30 years of financial history in your spreadsheets with Dividend Data’s seamless add-in for Excel and Google Sheets.
Visit
About Dividend Data
Dividend Data is a powerful tool designed to empower dividend and fundamental investors by seamlessly integrating over 30 years of stock market data into Google Sheets and Microsoft Excel. With access to more than 80,000 tickers, it allows users to retrieve a wide range of financial information, including dividends, yields, payout ratios, growth rates, financial statements, earnings, and other essential metrics—all without the need for API keys, coding, or tedious copy-pasting. The platform was built for investors who prioritize efficiency and accuracy, enabling them to access critical data instantly through simple custom formulas. This innovative approach ensures that users can analyze stocks effectively, enhancing their investment strategies and decision-making processes. Dividend Data's commitment to providing institutional-grade data at a fraction of the cost sets it apart, making it a preferred choice for serious investors looking to maximize their returns.
Features of Dividend Data
Instant Access to Data
With Dividend Data, users can type a formula directly into their spreadsheet, and the data appears live. This feature eliminates the hassle of manual data entry, allowing for quick analysis of dividends, stock prices, financial ratios, and more.
Extensive Historical Data
The platform boasts over 30 years of historical stock market data, making it an invaluable resource for investors looking to perform in-depth analysis and track long-term trends. This extensive dataset enables users to make informed investment decisions based on historical performance.
Multiple Custom Functions
Dividend Data offers 16 custom functions specifically designed to address the needs of dividend investors. These functions cover essential metrics such as forward yields, ex-dividend dates, and various financial ratios, simplifying the data retrieval process and enhancing analysis capabilities.
Cross-Platform Compatibility
Whether you prefer Google Sheets or Microsoft Excel, Dividend Data works seamlessly on both platforms. Its versatility ensures that users can analyze their investments in the environment they are most comfortable with, maximizing productivity and efficiency.
Use Cases of Dividend Data
Dividend Tracking
Investors can utilize Dividend Data to track upcoming dividends and yield percentages for multiple stocks. By using simple formulas, they can set up their spreadsheets to automatically update with real-time data, ensuring they never miss an important dividend event.
Financial Analysis
Fundamental investors can leverage the extensive historical data provided by Dividend Data to perform comprehensive financial analyses. By accessing various financial metrics, ratios, and earnings data, they can evaluate companies' performance over time and make informed investment choices.
Portfolio Management
Dividend Data allows users to automate their portfolio tracking, linking portfolios directly to their spreadsheets. This feature provides aggregate statistics at a glance, enabling investors to monitor their overall performance and make adjustments as needed.
Efficient Research
With the AI-powered research assistant included in Dividend Data, investors can conduct stock research more efficiently. By querying the AI for specific insights, users can gather information quickly, saving time while still accessing the data they need for informed decision-making.
Frequently Asked Questions
How does Dividend Data work?
Dividend Data functions by allowing users to input specific formulas into their spreadsheets, which then retrieve live data from their extensive database of stock market information. This real-time access eliminates the need for manual data entry.
Is there a free version of Dividend Data?
Yes, Dividend Data offers a free tier that provides users with 2,500 monthly credits. This allows investors to explore the tool and access essential data without any trial expiration, making it accessible for both new and experienced investors.
Can I use Dividend Data in both Google Sheets and Excel?
Absolutely! Dividend Data is designed to work seamlessly in both Google Sheets and Microsoft Excel. This cross-platform capability ensures that users can utilize the tool in their preferred spreadsheet application.
What types of data can I access with Dividend Data?
Users can access a wide range of data, including dividends, yields, payout ratios, growth rates, financial statements, earnings, various financial ratios, price history, and over 100 additional metrics, all tailored for dividend and fundamental investors.
Explore more in this category:
Similar to Dividend Data
Bank Statement Engine
Our free Bank Statement Engine helps your team instantly convert PDF statements to Excel, CSV, and more with no signup or limits.

iPulse
iPulse lets your team harness AI for real-time market forecasts, signals, and risk insights to drive smarter, collaborative decisions.

TryBit
TryBit helps your business and your team seamlessly accept over 40 cryptocurrencies online with low fees and strong security.

helpdol
Helpdol helps your team track expenses, forecast cash flow, and manage receipts using voice commands, all in one collaborative finance app.
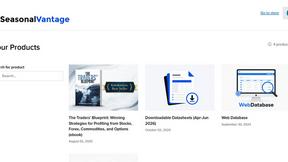
SeasonalVantage
SeasonalVantage helps traders and teams discover high-probability trades by combining seasonal data with options flow signals.
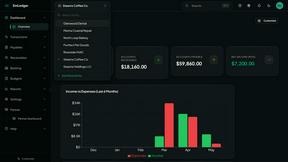
EmLedger
EmLedger unifies multi-entity accounting across all your businesses with real double-entry and real consolidation, all for one flat fee.
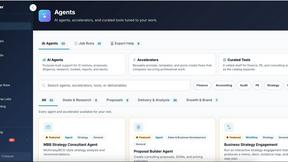
Decker
Decker is your team's operating system for building review-ready deliverables and earning from your expertise together.

Liners Africa
Liners Africa is your comprehensive guide to discovering, comparing, and reviewing software tailored for the African market.