StatPecker
StatPecker delivers rapid AI-driven insights and stunning visuals from your data for impactful storytelling and.
Visit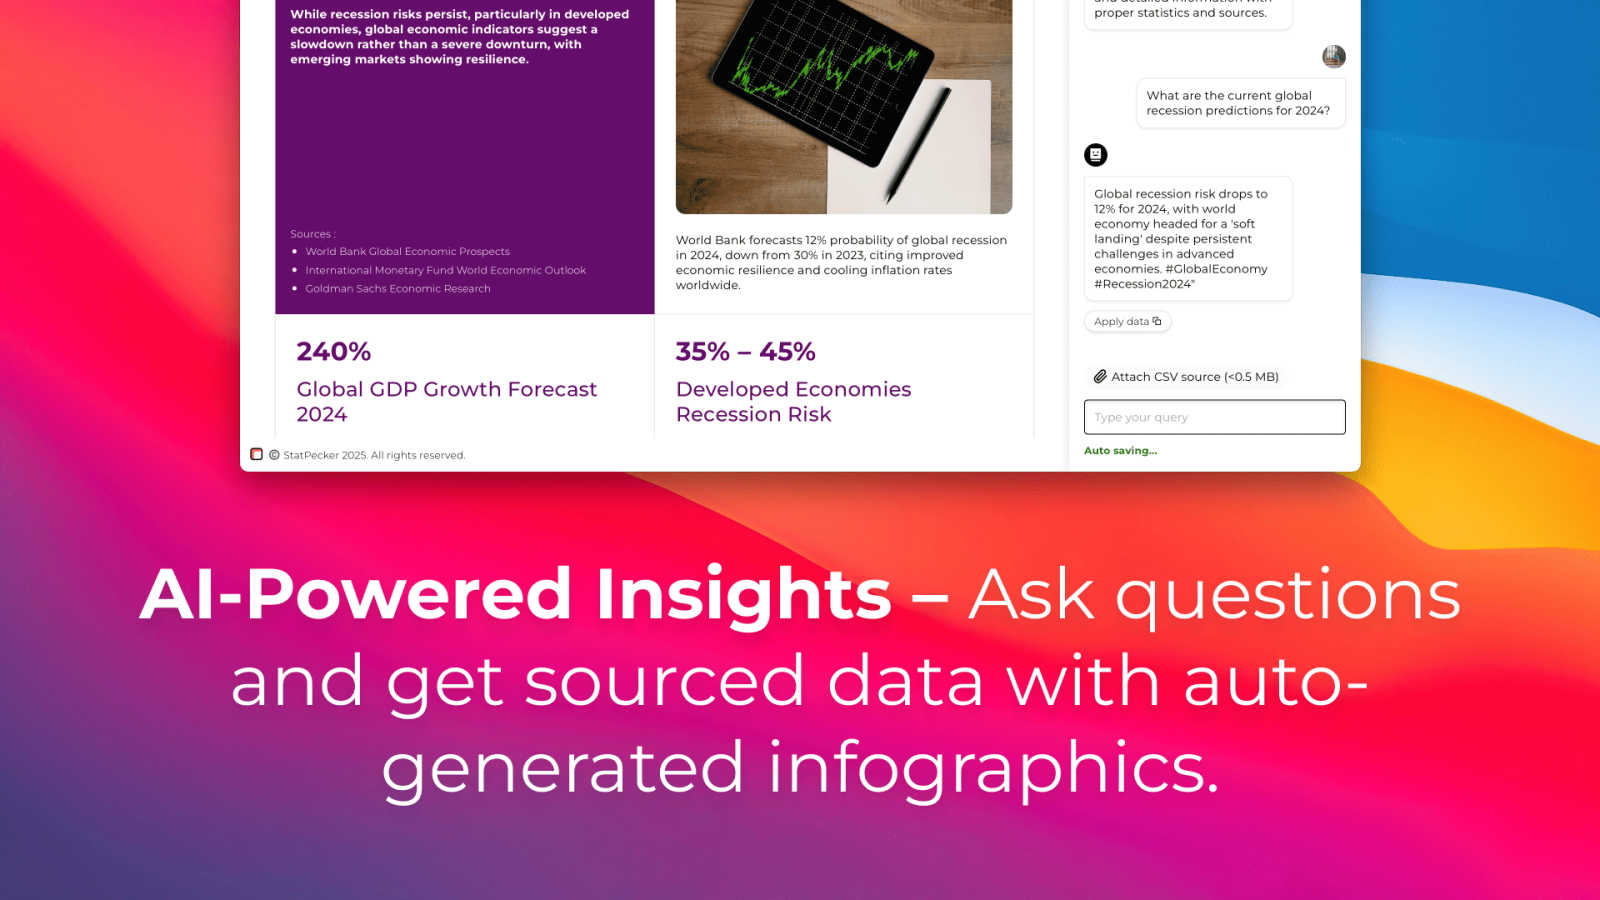
About StatPecker
StatPecker is an innovative AI-powered tool that transforms the way individuals and organizations visualize data. Designed for a diverse audience including content creators, analysts, marketers, and educators, StatPecker makes data storytelling accessible to everyone. The platform excels in converting raw data into visually appealing infographics within seconds, enabling users to communicate insights clearly and effectively. With its user-friendly interface, StatPecker allows users to analyze CSV files effortlessly, derive significant insights, and create engaging visuals that captivate audiences. By eliminating the need for manual reporting and expensive design services, StatPecker empowers users to focus on core messages while the robust AI handles the technical aspects of design and data visualization. As a collaborative platform, it fosters teamwork and creativity, ensuring that insights can be shared, published, or presented seamlessly.
Features of StatPecker
Ask Your Query
StatPecker allows users to obtain instant insights from validated sources using AI, eliminating the need for complex tools. Users can simply type in their questions and receive quick, credible answers, streamlining the data analysis process.
Publish & Embed
This feature enables users to make their visuals interactive and easily integrate them into blogs, articles, and websites. By enhancing the user experience, StatPecker ensures that the infographics created are not only informative but also engaging for the audience.
Upload & Analyze CSVs
Users can effortlessly upload CSV files of up to 50 MB and explore their data without the hassle of traditional spreadsheets. This feature prioritizes privacy by running analyses on the user's device, ensuring that sensitive information remains secure.
Download & Use Anywhere
StatPecker allows users to export their infographics as images, making it easy to incorporate them into reports, presentations, and other materials. This flexibility means that users can share their insights in a variety of formats without any additional hassle.
Use Cases of StatPecker
Data Visualization for Marketing
Marketers can utilize StatPecker to create eye-catching infographics that summarize campaign performance, customer demographics, and market trends. This visual storytelling approach enhances presentations and makes data more relatable for stakeholders.
Educational Insights
Educators can leverage StatPecker to visualize complex data, such as student performance metrics or curriculum effectiveness. By presenting these insights in engaging formats, they can better communicate findings to students, parents, and administrators.
Business Analytics
Business analysts can use StatPecker to quickly derive insights from sales data, financial reports, and operational metrics. The ability to visualize this data helps teams identify trends and make informed decisions based on real-time information.
Team Collaboration
StatPecker fosters collaboration among teams by allowing multiple users to work on data analysis together. Teams can share insights, create visuals, and collaborate on presentations, ensuring everyone is on the same page and contributing to the overall success.
Frequently Asked Questions
What types of files can I upload to StatPecker?
StatPecker allows users to upload CSV files of up to 50 MB. This feature enables users to analyze their data without the need for additional software or complex tools.
Is my data safe when using StatPecker?
Yes, StatPecker prioritizes user privacy by conducting all data analyses on your device. Your data remains secure and is not shared with external servers during the analysis process.
Can I integrate StatPecker visuals into my website?
Absolutely! StatPecker provides options to publish and embed your created infographics into blogs, articles, and websites, enhancing your content with engaging visuals.
What support options are available if I encounter issues?
StatPecker offers support through its website, where users can access help resources and contact the support team for assistance with any issues they may face while using the platform.
Explore more in this category:
Similar to StatPecker
GeoRank
Planning a relocation or long-term stay abroad? Compare places on sunshine, cost, tax, visa access for your passport, then ask AI about your short

Video2URL
Turn videos into clean, shareable, trackable URLs in seconds.
Anime Maker
Create anime images, characters, logos, filters, and image-to-video concepts with AI.
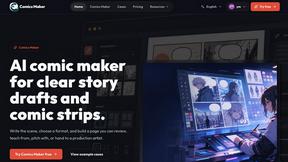
ComicsMaker
AI comic maker for turning prompts into comic strips, manga panels, storyboards, and export-ready visual drafts.

NanoReads
Personalized reading and writing app for books and a book marketplace. Read and write stories with AI on web, iOS and Android.
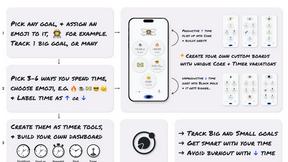
Flowton
Pick a goal, label time spent as Up time or Down time. Improve the ratio.