AskCSV

About AskCSV
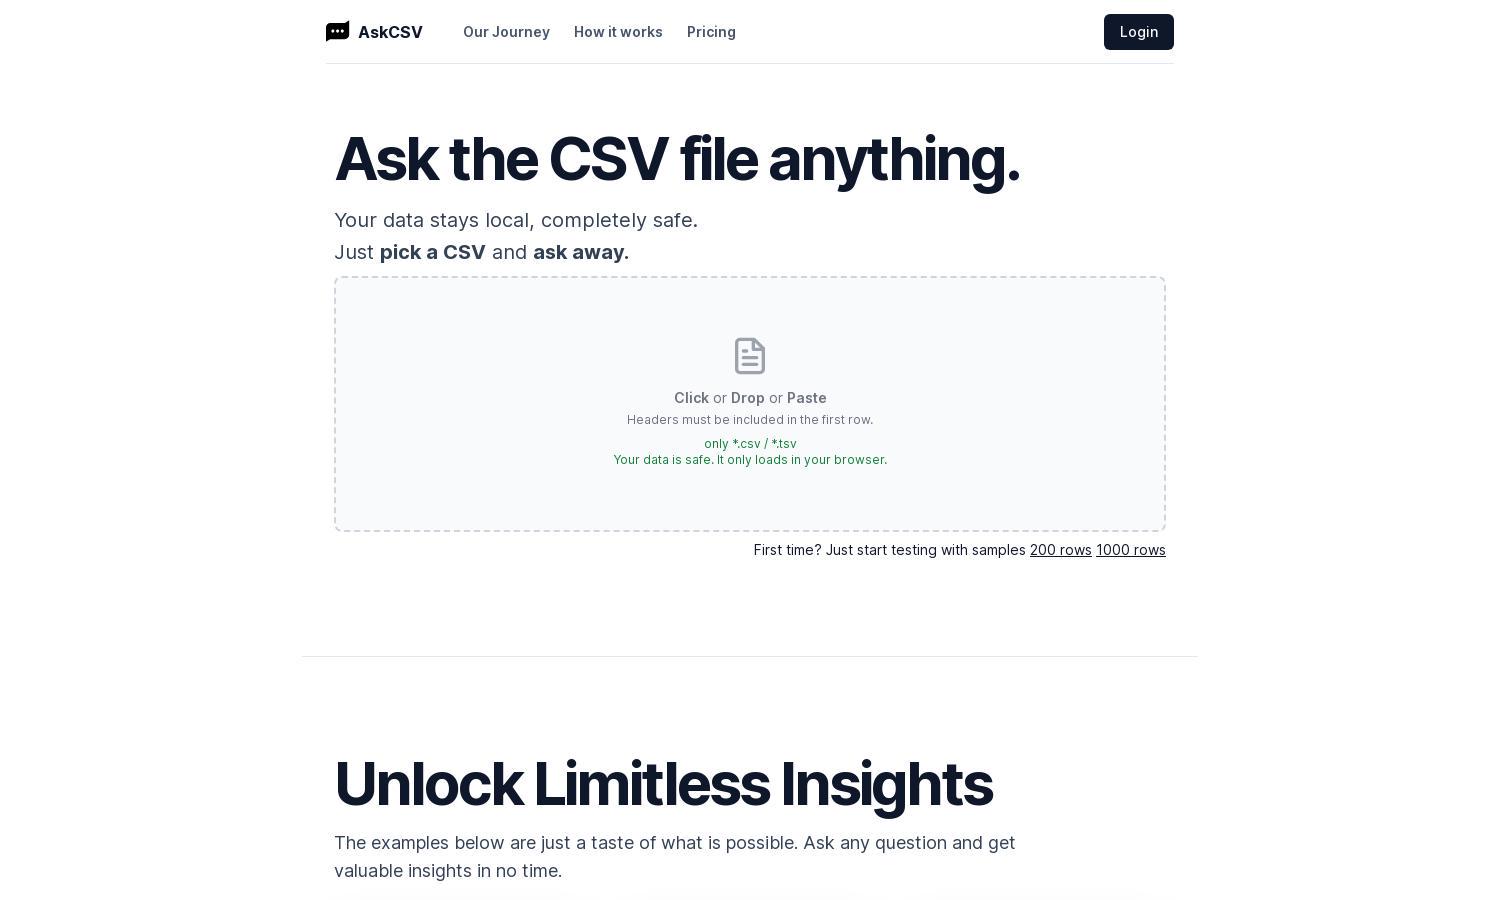
AskCSV is an innovative platform that simplifies CSV file analysis for everyone. Users can upload files locally, ensuring data privacy while utilizing AI to extract valuable insights and visual representations. This unique feature makes data analysis accessible for both businesses and casual users alike.
AskCSV offers a free version for basic uses, with premium subscriptions that unlock advanced features. Each tier provides increasing value, such as enhanced data visualization tools and priority support. Upgrading to a premium plan enhances the analytics experience, making data insights even more actionable.
AskCSV features an intuitive user interface that streamlines the data analysis process. The layout is user-friendly, prioritizing ease of navigation and quick access to essential tools. The design ensures that users can effortlessly interact with their CSV data, making analysis straightforward and efficient.
How AskCSV works
Users start by uploading a CSV file directly to AskCSV's web app, where data is processed locally for security. They can then interact with the AI by asking questions about their data. The platform analyzes the queries and generates insightful charts and tables, providing immediate results that empower users in their decision-making process.
Key Features for AskCSV
AI-Powered Data Insights
AskCSV's AI-powered data insights help users uncover valuable information from their CSV files. By simply asking questions about their data, users receive instant analytical visualizations and clear responses, enhancing their understanding of trends and patterns in the data effortlessly.
Secure Local Processing
AskCSV processes your data locally in the browser, ensuring complete privacy and security. Unlike other platforms, it never uploads your files to a server, giving users peace of mind while working with sensitive data. This unique feature sets AskCSV apart in the data analysis landscape.
Versatile Data Visualizations
AskCSV offers versatile data visualization tools that automatically generate the best charts for your dataset. This feature allows users to represent their findings clearly and effectively, aiding in understanding complex data patterns and trends without needing extensive technical knowledge.
You may also like:


